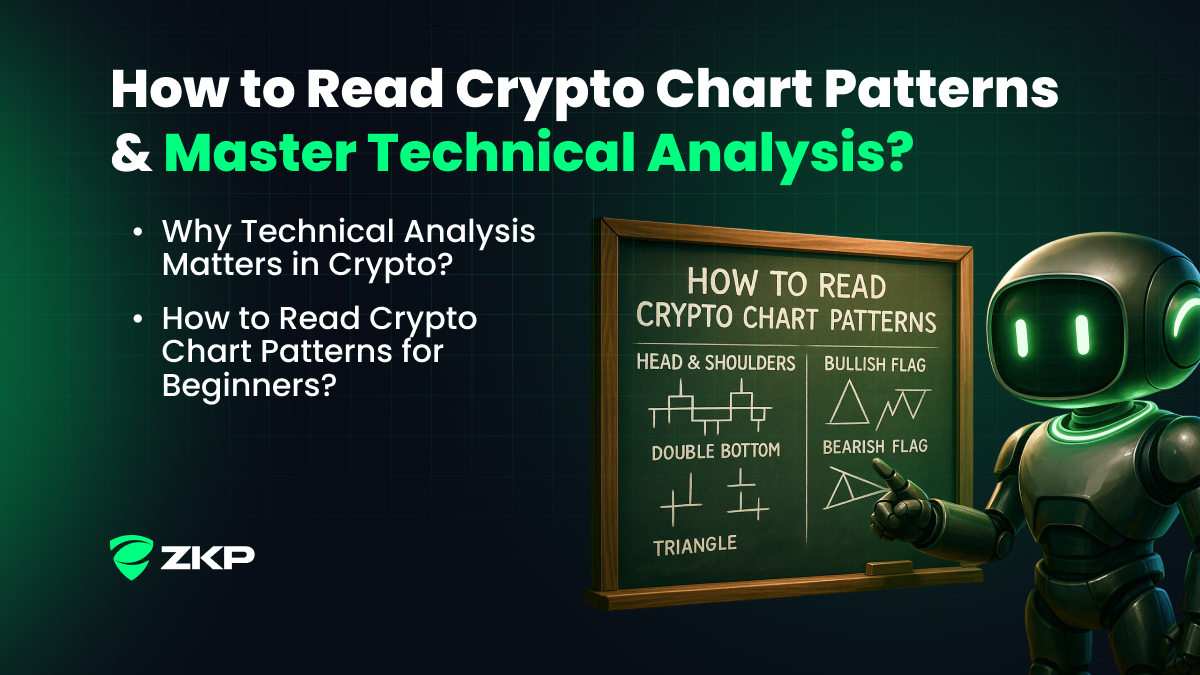
How to Read Crypto Chart Patterns & Master Technical Analysis?
How to Read Crypto Chart Patterns & Master Technical Analysis?
Release Date: November 1, 2025
Share with your community!
Let’s be real, crypto charts can look like a total mess at first. Lines everywhere. Patterns that look like a Rorschach test. And a million opinions from Twitter traders. But here’s the good news, once you learn how to read crypto chart patterns, the chaos starts making sense.
If you’re new to all this you’re in the right place. And if you’ve been winging it, it might be time to step things up with a bit more clarity, confidence and a real plan that doesn’t rely on luck.
What You’ll Learn?
What crypto chart patterns are and why they matter
How to read trading patterns (even as a beginner)
A step-by-step guide to mastering technical analysis
How to spot crypto signals that matter
What Are Crypto Chart Patterns?
Think of crypto chart patterns as the body language of the market. They're shapes that form on price charts, and traders use them to guess what might happen next. It’s not fortune-telling, it’s pattern recognition. And it's at the heart of technical analysis.
When you look at a crypto chart, you're looking at thousands of decisions by buyers and sellers. Those movements create recognizable patterns.
Here are a few classics:
Head and Shoulders: Often means a trend is running out of steam.
Double Top or Bottom: Think of it like the market saying “nope, not going higher/lower.”
Triangles: Can signal a breakout coming soon.
Flags and Pennants: The market’s taking a breather before the next move.
These patterns are what we call crypto signals. They don’t guarantee anything, but they can help you make smarter trades when paired with solid crypto price analysis.
Why Technical Analysis Matters in Crypto?
Crypto’s wild. We’re not trading blue-chip stocks here. Prices swing fast. Rumors move markets. And emotion often overrides logic. That’s why technical analysis matters, it helps cut through the chaos.
By learning how to spot patterns and signals, you build a playbook that keeps you calm when others panic. That’s how seasoned traders spot opportunities before they go mainstream.
How to Read Crypto Chart Patterns for Beginners?
Here’s how you start turning crypto charts into something you can actually use.
1. Know The Pattern Types
Let’s keep this simple:
Continuation patterns mean the price is likely to keep moving in the same direction (flags, triangles).
Reversal patterns suggest it could flip (head and shoulders, double tops).
2. Spend Time With The Charts
Practice. A lot. Use a free charting tool like TradingView. Look for shapes forming. And use a tool to track crypto chart patterns that match what you see.
3. Don’t Just Guess, Use Indicators
Patterns are helpful, but they’re not enough.
Use indicators like:
RSI to see if something is overbought or oversold.
MACD to check if momentum is building.
Volume to see how strong the move is.
4. Spot the Trend
Learning how to spot trends using crypto charts is a big one. Uptrend? You’ll see higher highs and higher lows. Downtrend? Lower highs, lower lows. No clear direction? Might be time to wait.
Applying Technical Analysis: A Step-by-Step Guide
Step 1: Choose Your Charting Platform
Grab something like TradingView. Keep an eye on trades, signals, and your actual crypto, all in one place.
Step 2: Pick Your Timeframe
Day trading? Stick to 5-minute to 1-hour charts. More long-term? Daily or weekly charts give a better picture.
Step 3: Look for Patterns
Now that you know the basics, it’s time to start spotting crypto chart patterns in the wild.
Step 4: Confirm Before You Commit
See a pattern? Cool. Now double-check with your indicators. No confirmation? Walk away.
Best Chart Patterns for Crypto Trading Success
Want the greatest hits?
Here they are:
Bull Flag: Fast move up, short rest, more up.
Falling Wedge: Looks bearish, but often breaks upward.
Ascending Triangle: Price keeps knocking on resistance, usually breaks through.
Double Bottom: Price drops, recovers, drops again, then rebounds. Market says “we’re done falling.”
Master these and you’ll be reading the room better than most.
Understanding Crypto Price Patterns & Signals
Patterns give you the shape. Crypto signals give you the context.
A breakout isn’t worth much if it’s on low volume. An RSI at 80? The market might be too hot. Crypto price analysis is where you bring together price action, indicators, and common sense to make sense of what the market is trying to tell you.
FAQ: Everything Beginners Need to Know
Q: Do chart patterns work for crypto?
A: They can, but nothing in trading is a sure bet. Patterns show probabilities, not promises. Combine them with indicators and smart risk control.
Q: What is the best chart pattern for crypto trading success?
A: Depends on market conditions, but ascending triangles and bull flags are reliable in bullish environments.
Q: How do I spot trends using crypto charts?
A: Check if price keeps making higher highs and higher lows (uptrend) or the reverse (downtrend). Indicators help confirm it.
Q: What are crypto signals and how do I use them?
A: They’re clues from indicators and chart patterns that suggest a potential move. Use them to plan entries and exits.
Final Thoughts
Let’s wrap this up. Reading crypto chart patterns isn’t some secret skill only the pros have. It’s something anyone can learn with time, patience, and the right tools. These patterns tell stories about momentum hesitation and potential breakouts.
When you pair that story with proper technical analysis, you start seeing trades before they happen. You’ve got the patterns. You’ve got the signals. And now, you’ve got the tools to actually use them.
Keep Reading Blog Posts
You've just scratched the surface — dive deeper into the fundamentals of ZKP.